Estimate Step Complexity#
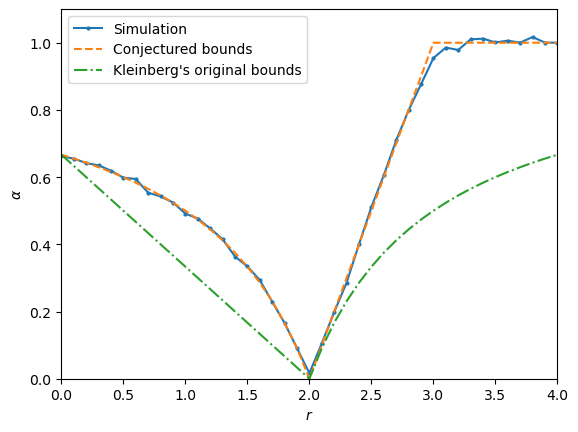
The simulator allows to compare Kleinberg’s original bounds with simulation and to conjecture tighter bounds.
[1]:
from kleinberg_grid_simulator import estimate_alpha, parallelize
from matplotlib import pyplot as plt
[2]:
rr = [r/10 for r in range(0, 41)]
res = parallelize([{'r': r, 'budget': 10000 if r!=2 else 1000} for r in rr], function=estimate_alpha)
100%|███████████████████████████████████████████████████████████████████████████████████| 41/41 [00:00<00:00, 95.43it/s]
[3]:
plt.plot(rr, [re[0] for re in res], marker='o', markersize=2, label='Simulation')
plt.plot(rr, [(2-r)/(3-r) if r<2 else ( r-2 if r<3 else 1 ) for r in rr], '--', label="Conjectured bounds")
plt.plot(rr, [(2-r)/3 if r<2 else (r-2)/(r-1) for r in rr], '-.', label="Kleinberg's original bounds")
plt.legend()
plt.xlim([0, 4])
plt.xlabel('$r$')
plt.ylabel('$\\alpha$')
plt.ylim([0, 1.1])
plt.show()

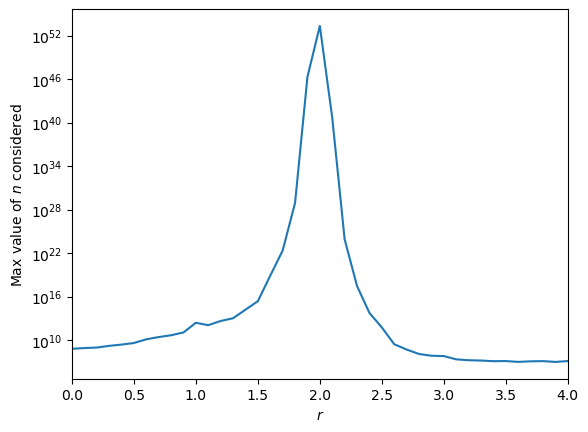
Look how far we went to compute the values:
[4]:
plt.semilogy(rr, [re[1] for re in res])
plt.xlim([0, 4])
plt.xlabel('$r$')
plt.ylabel('Max value of $n$ considered')
plt.show()
